KPI Definition and Meaning
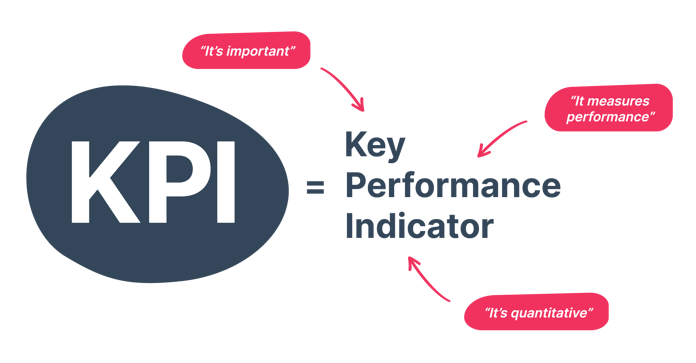
KPI stands for key performance indicator. These are measurable values that show progress toward an intended result or goal, most notably in business (though you can use them to track your personal performance as well). Essentially, they are how teams and businesses track progress towards goals and overall objectives.
High-level KPIs are tracked at a business-wide level, while low-level KPIs are more focused on the performance of individual teams like marketing or sales. Don’t be fooled though, low-level KPIs are no less important. Both of these data sets are key to having a full understanding of whether you are achieving your goals and objectives.
Types of KPI
You won’t be the first and certainly won’t be the last to assume KPIs are all numbers. While many of them are, it’s important to think of KPIs as measurements of progress that often go beyond a number. There are various types of KPIs, all of which add value and direction to your business strategy.
Quantitative indicators
Chances are when you think of KPIs, you are thinking of quantitative KPIs. These are ones that can be objectively measured as a fixed unit or value. They are often the most common type and reveal clear, concise, and data-based insights about a business's performance. Often, quantitative KPIs are the ones that stand out most in a report, but relying on them alone may leave valuable knowledge gaps that could lead to bad decision making. They are most frequently reported as a number, cost, or percentage and examples include customer churn rate, lead to customer conversion rate, customer lifetime value, or cost per lead.
Qualitative indicators
Qualitative KPIs on the other hand are not measured by numbers but instead consist of opinions, attitudes or characteristics, often involving human interpretation. This type of KPI is much more subjective in nature than quantitative and is slightly more difficult to measure. A common example of a qualitative KPI is customer or employee satisfaction surveys. The survey itself can be given in the form of quantitative data e.g ‘On a scale of 1 to 10, how would you rate your experience?’ So although the answer will be given as a numerical value, the measure itself is based on a subjective interpretation of a person's opinion.

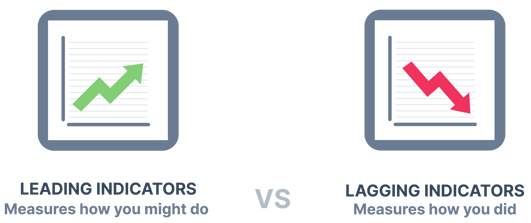
Leading indicators
Leading indicators are a bit like a crystal ball. Okay, not exactly, but they focus on what might happen in the future. As the name suggests, they ‘lead’ to successfully meeting your objectives by showing the progress already made and help keep you on track to hitting your goal. They are used most often as forward-looking indicators to more accurately anticipate what results can occur from a specific business decision. It’s important to think of these as what might happen, rather than what definitely will happen.
A good leading indicator to measure could be customer satisfaction. A high market share or high customer satisfaction score will reflect high future sales or revenue. This might be a more accurate way to gauge future profits, rather than projecting current profits. Once you have established your leading indicator, you can track real-time data against this figure to assess progress and see how close it is to your initial prediction, giving you a chance to take corrective action if needed. Be careful though, if you are using your sales pipeline as a leading indicator, the opportunities may not actually end up converting into sales, meaning your leading indicator will be inaccurate.
Lagging indicators
Where leading indicators consider the future, lagging indicators focus on the actual outcomes and whether something did or didn’t happen e.g number of deals closed or profits made at the end of the month. They will tell you about what has already happened and are used to gauge historical performance or analyse the impact of a business decision. The obvious drawback of lagging indicators is that as they are backwards-looking, they may provide insights too late so adjustments or tweaks cannot be made to positively impact the result. KPIs like ROI, customer acquisition cost, and revenue churn rate would all be considered lagging indicators.
Why are KPIs Important?
KPIs are more than just a set of numbers, they help us to really understand the overall performance of both a business as a whole and individual teams. This is important for a few reasons.
Help to make decisions
The best decisions in business, and marketing specifically, are data-driven. In order to make these types of decisions, you need the data at your fingertips. When you’re tracking (the right) KPIs, you have the information you need to make informed, tactical decisions. Let’s say that your sales team isn’t performing as you want them to. Without KPIs, you will likely be making decisions based on anecdotal evidence and hunches, which will make it harder to actually improve your stats. In that same situation with focused KPIs, you can pinpoint what area of the sales process isn’t functioning and can make changes where they are actually needed.

Source: Google
KPIs vs Metrics
You may be thinking KPIs sound an awful lot like metrics, aren’t they just the same thing? The short answer is no and the difference is more than semantic. So what is the difference? In the most basic sense, KPIs are focused, specific indicators of goal performance.
Metrics are more general, providing an overview of the business as a whole. They are not tied to a specific goal and individually they don’t really provide much insight. Have you ever heard of the term vanity metric? These are the ones, like the number of emails sent or number of sales calls made, that make you feel good but don’t really tell you anything about how you’re doing.
KPIs, on the other hand, are tied to specific goals and outcomes. For a measurement to be a KPI it must have a specific target, a timeframe, and be tied to key business objectives. Metrics can be used to support KPIs, wherein specific KPIs are made up of metrics, then tied to a goal or outcome.
For example, as we said above, the number of marketing emails sent is a metric. To make it a KPI, we need to add more information. If your overall business goal is to create 20% more MQLs per quarter, you will be interested in how many emails are sent, because you will want to know how many email recipients have gone on to become MQLs. The metric will be the email sends, but the KPI will be the conversion rate of those email contacts within the given time frame, in this case, quarterly.
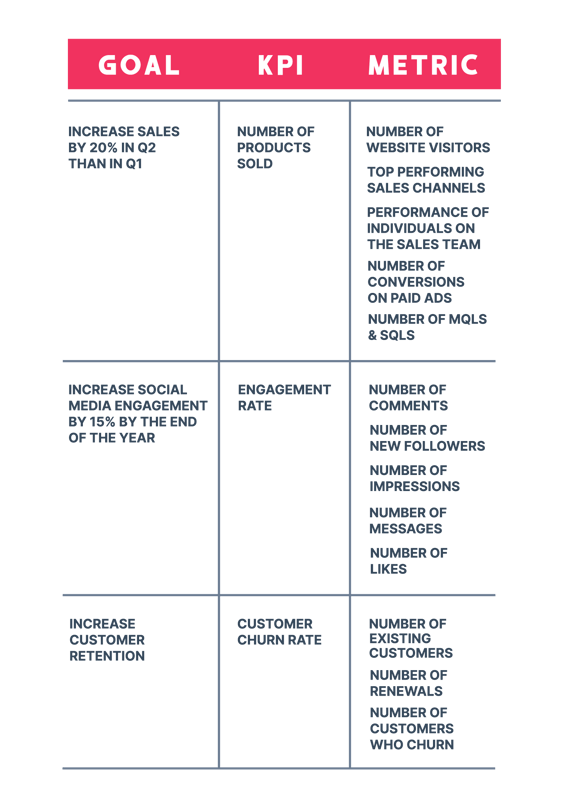
Examples of KPIs vs Metrics
Related reading: The Difference Between KPIs & Metrics
How to Choose the Right KPIs for Your Business
Choosing the right KPI for your business can seem like a daunting task, especially given the sheer amount of data that is available. First and foremost, it’s important to remember that you don’t need to track everything. In fact, measuring too many will defeat the purpose of tracking KPIs at all, providing too much information and making things unclear. So, the question remains, how do you decide what KPIs to track?
Choose KPIs that are directly related to your business goal
By their definition, KPIs are indicators of company performance of specific goals, so any KPI you choose to track should relate to your overall business objectives. For example, if your business is looking to increase revenue, your chosen KPIs would revolve around revenue generation.
So when you’re setting your KPIs ask yourself: what are your company goals? Are there any obvious areas for improvement? What are the biggest priorities for your c-suite?
 Source: Google
Make it a team effort
KPIs aren’t just a way of measuring performance, they are a form of communication. To be effective, they need to work within the context of the wider business. That’s why, when you’re deciding on your KPIs, it’s very important to do so at a business-wide level, with input from other teams. Setting KPIs without this cooperative effort will make it much harder for everyone to achieve their goals.
Think about a customer success team. One of their main KPIs may be to increase the trial to customer conversion rate. A great way to measure customer success, right? But if the marketing team is pivoting away from free trials as part of their overall strategy to increase revenue, how successful will the customer success team be? Every team in a business is interconnected, so it’s crucial their KPIs complement not just the overall goals, but each other’s strategies
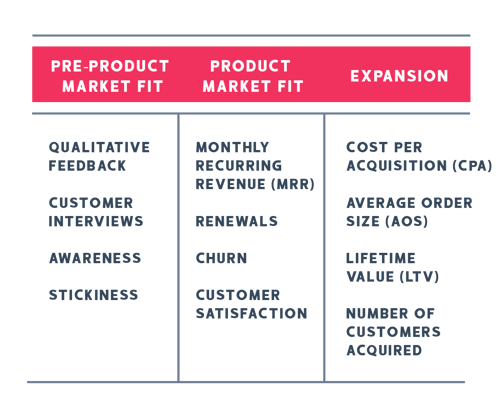
Consider what stage of growth your company is in
Different KPIs will be important for different types of companies. Start-ups, for example, will have big growth goals, so their KPIs will relate to growing their business as a whole. Established enterprise-level businesses will, in a lot of cases, be more focused on retaining existing customers and controlling costs, so their KPIs will reflect that.
Here are some examples:
Make sure you include both leading and lagging indicators
As we’ve discussed, lagging indicators show you how you did, while leading indicators show how you are doing. One isn’t better than the other. Much like metrics vs KPIs, they work in tandem to provide a robust picture of your progress.
Lagging indicators provide the progress on something that has already happened, for example, the number of customers who have renewed or how many emails have been sent. Leading indicators indicate how likely you are to achieve a goal in the future. They help you predict how you will be doing. Think of KPIs like conversation rate, lead velocity, and so on.
You will likely be familiar with lagging indicators as that is how most businesses measure their progress. That’s because they are easy to track - they already happened - and easy to report on. While it’s always good to know what’s happened in the past, ensuring your KPIs are also forward-looking means you can stay on track and on trend. Identifying which leading indicators will drive your business forward will definitely put you on the path to success.
Avoid vanity metrics
Vanity metrics are those KPIs or metrics that are designed to make a team or department look good that can be easily inflated and provide no real insight into how you’re actually doing. One great example of a measurement that may seem valuable but can easily be a vanity metric is website traffic. On its own, website traffic provides almost no actionable insight into your team's performance and can be easily inflated through the use of paid channels. A better KPI to track would be the conversion rate or even the number of customers that come from your website. These tell you about the quality of your traffic, rather than just the quantity. Perhaps that is the best differentiator between a quality KPI and a vanity metric is that the former has some indication of quality.

It’s also extremely important when you’re choosing and tracking your KPIs to make sure they are SMART, or even better, SMARTER. You’ve probably heard the acronym before, but SMARTER takes your KPIs and targets one (actually, two) steps further.
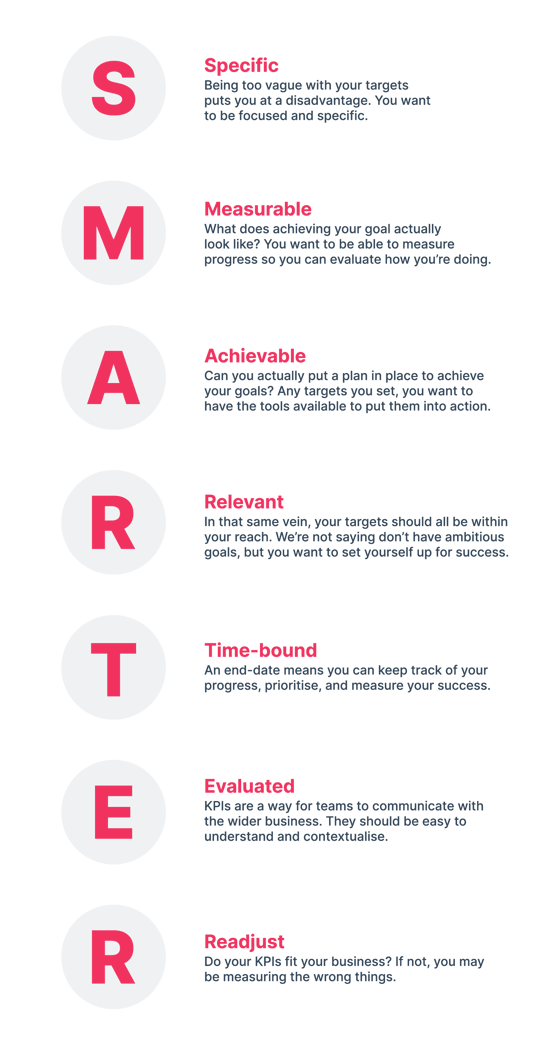
To build out your SMARTER KPIs you need to ask yourself a few questions:
A large part of making sure that your KPIs and goals are SMARTER is making them measurable. But how we measure these can be tricky. The specific criteria you use to measure will be dictated by the KPI itself. For example, some will be quantitative and others will be qualitative.
The main thing to remember is that KPIs should measure performance, not the activity. Actions, not results. This means that instead of this:
- I want to send 10 marketing emails this week.
A KPI should look like this:
- I want to generate 10 MQLs from marketing emails this week.
The first example is more of a metric than a KPI because there is no real way to measure actual performance. As we said when we outline the difference between metrics and KPIs, KPIs are more than a quota, they are an indicator of how well a person, team, or business is performing.
When it comes to how to measure specific KPIs, that will depend on what type of KPI it is and what data you are taking into account. For example, a revenue-based KPI will likely be measured in terms of revenue generated whether that’s MRR, ARR, or some other method.
What will be common across all the KPIs you do track, or should be, are the tools you use. There are a lot of ways to track your KPIs, some easier than others. The most common forms of tracking, and importantly, sharing your data will be KPI reports and KPI dashboards.
What is a KPI Report?
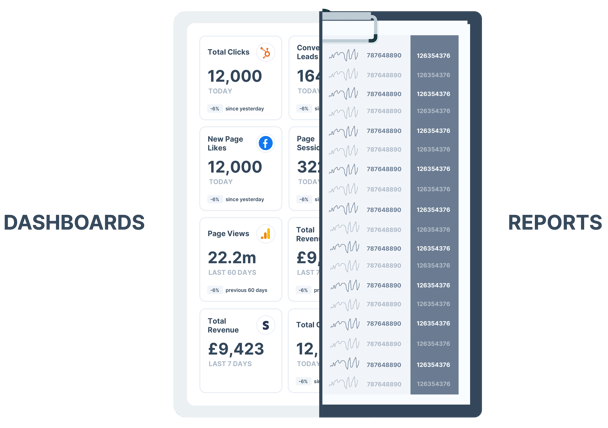
A KPI report is a type of report that uses a mixture of visual elements - think charts, tables, graphs, etc. - and written elements to make data more accessible and digestible. However, it still provides detailed information surrounding your chosen data points to allow for in-depth analysis. Typically, KPI reports are static documents that you update at a set point in time, whether it’s for a monthly meeting or showing your yearly results.
What is a KPI Dashboard?
A KPI dashboard is also a visual display of important information i.e. interactive charts and graphs, but they allow for a quick, streamlined review and analysis. Any good KPI dashboard allows users to explore the data behind their indicators and discover actionable insight. Essentially, a KPI dashboard transforms large swathes of data into digestible packets of information that allow your business to make data-driven decisions. The main driver of a KPI dashboard is that it unites different data sources so that users can easily explore massive data sets in an at-a-glance visual representation.
KPI Dashboard vs KPI Report
KPI dashboards are real-time snapshots of specific data points. They update as and when the data gets fed into them, and are a great way to distil complex data down into understandable, actionable packets of information.
Related reading: 6 Benefits of KPI Reporting
Benefits of a KPI Dashboard
- Provide a quick overview of the most important data for stakeholders, managers, and teams
- Offer an early warning for any potential issues or problems
- Provides the information and analytical tools to proactively fix any issues that have been identified
- Provide a unified view of what all teams and departments should work towards, preventing any miscommunication or misunderstanding
KPI reports, on the other hand, are static documents that offer detailed overviews of a much larger picture. KPI reports collate data over a specific time period, for example, if you want to understand how well your outbound sales campaign worked in Q4. KPI reports are used when a real-time dashboard may not be enough to fully gauge the success and draw conclusions, for instance, when you need to see data over a longer period of time.
For that reason, when it comes to everyday tracking and measurement of your KPIs, a KPI dashboard can be really useful. You can then use KPI reports when a fuller picture is needed or when you want to see a more detailed view of your main data points.
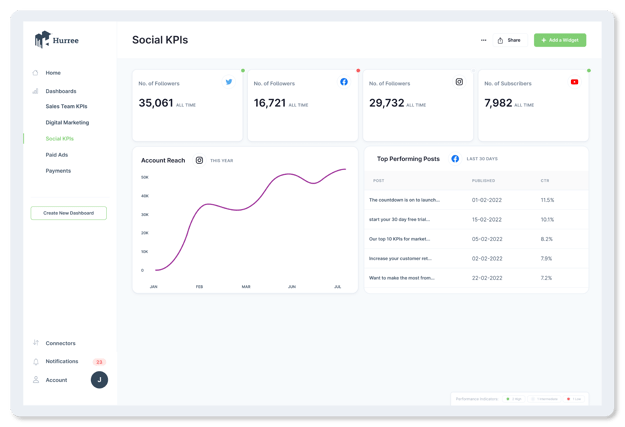
Tips for Creating an Effective KPI Dashboard
Know your audience
When you’re setting up your dashboard, ask yourself - who is this for? Knowing that will make it easier to decide what to include on your dashboard. Is it just for your own use? Or will this be seen by upper management?
Once you know the answer to these questions, ask yourself what they want to see. Or better yet, ask them. It doesn’t hurt to confirm what sort of information your team actually needs to see in your dashboards to avoid any confusion or time wasted.
Different people may want to see different information, and that’s ok. You can always create more than one KPI dashboard for each set of data, or you can get creative with building it out. Just remember not to overwhelm your audience with information.
Keep it simple
With that in mind, another tip for building your KPI dashboard is to keep it simple. If you include too much data or overcomplicate, you are negating the benefits of putting a dashboard together in the first place.
Make sure you’re only choosing the most important KPIs as part of your dashboard. As mentioned above, if you have conflicting audience needs, maybe consider building more than one to avoid overwhelming people with information.
White space is your friend
Just as it’s important to keep your information simple, you also need to ensure the design and visuals of your KPI dashboard make it easy to comprehend. The information is meant to be easily digestible at a glance, so a complicated or overwhelming dashboard design may interfere with this. Being aware of the whitespace in your dashboard will help.

Source: Adobe
Tell a story
KPIs are useful on their own, but they can be even more beneficial when they tell a story. What does that mean? Well, first off, context is important. Some indicators may need a description, so make sure you have a title and overview that tell the viewer exactly what they’re looking at.
It’s also important to include metrics that show each stage of the process.
For example, if you’re including your lead to MQL conversion rate, you’ll probably also want to include your MQL to customer conversion rate. Including both KPIs means you see the full picture of your leads, whereas only tracking one provides an incomplete story and can influence making the wrong decision.
Make it actionable
If you’ve chosen the right KPIs, this one will be fairly easy to achieve. However, you’ll want to check that you’re presenting the information in a way that can be used to actually evaluate performance and act accordingly.
A good way to do this is to include your overall goals and targets, and to compare your KPIs directly to them. This can either be the previous periods' results, industry benchmarks, or your own growth targets.
Make sure it’s easy to update
Again, this may seem obvious but a dashboard that is difficult to update isn’t fit for purpose. The whole reason for a KPI dashboard is to make it easy to track your progress, part of that is having up-to-date data that shows you the information you need. So when you’re building your dashboard, or even choosing your dashboard software, you want to make sure it’s easy to get the most up-to-date data.
And it’s just as important that you can change the dashboard itself quite easily, especially for certain industries. Industries like SaaS, tech, and marketing change on a whim, and the information you need to track may change regularly. You want your dashboard to make the process efficient and intuitive.
Consider the type of dashboard you want to build
There are a number of different types of KPI dashboards, beyond even what industry or function your team serves within your organisation.
Strategic/Executive: Provides high-level information to managers and executives that allows them to understand the overall health of the business. It will also help identify opportunities for growth or improvement. These don’t need to be overly detailed and should include simple, aggregated metrics.
Analytical: This type of dashboard helps understand trends across different time periods, and takes into account different variables. It will likely contain more detailed data than other types of dashboards because the ultimate goal of the analytical setup is to understand both your goal and the underlying activity of the team/department. It’s also important that these types of dashboards are interactive so that multiple variables can be explored.
Operational: Here, you’ll monitor real-time data in order to flag performance issues in real-time. The most important aspect of these is to provide alerts to specific users and provide the exact information they need to quickly solve the problem and get things back to normal.

KPIs in Marketing
Marketers are often expected to be the jack of all trades to drive revenue and business growth. Marketing needs to be measurable but in a world full of data what is best to track? Even the most experienced marketing teams can sometimes lose sight of what is important and what metrics provide the most useful data.
- Customer acquisition cost
As the name suggests, this refers to the total cost required to acquire a new customer over a specified time period and the lower this is, the better. This is a useful metric to track as it compares the amount of money spent against the number of customers a company gained.
- Customer lifetime value
Over the time a customer stays loyal to your company, how much are they likely to spend? Measuring customer lifetime value and comparing it against customer acquisition costs allows you to measure a customer's profitability and estimate the long term growth of the company. - Website traffic
A website is usually the first point of contact a customer typically has with a company. Monitoring the amount of traffic and where traffic comes from will highlight where your marketing efforts are paying off. You could look at the number of visitors, the number of sessions, the click rate, pages visited, conversion rate and more to gain deeper insights into the performance of your website and the quality of your visitors. - MQLs
A marketing qualified lead is a customer who has engaged with your company and could become a more serious prospect if you nurture the relationship. If you don’t track MQLs, you don’t know if the content you are producing and your marketing activities are attracting the right type of leads. - Return on investment
ROI refers to the amount of money you generate compared to the cost that you have spent on marketing. Typically, ROI is used to justify marketing spend and budget allocation for future campaigns and activities.
Related reading: 6 KPIs that marketers should be tracking
KPIs in Marketing Agencies
Anyone working in a marketing agency will know it’s fast-paced, high pressure and you will often have clients chasing you for updates, results, reports and more. While each client will have different requirements and goals, here are a few that will give your client reassurance that the money they are spending with you is paying of:
- Marketing qualified leads (MQL) to sales qualified leads (SQL) conversion rate
Generating MQLs is great, but how many move on to become sales qualified leads? Measuring this figure is one of the best ways to determine the overall quality of leads and how well your lead generation and nurturing strategies are working. - Customer churn
This is the percentage of customers who stop doing business with a company after a certain period of time. Naturally, customers will move on and stop buying from you, but if you see this number increase then it highlights that your clients' customers are no longer receiving the desired value from the product or service. - Social media conversion rates
This shows whether or not your client’s social media followers are performing the actions outlined in the posts. Having high conversion rates indicates that the post is delivering value and suggests the content you are putting out is relevant to your clients' followers. While conversion rate is usually top of the list for social media metrics, there are also a few other values that are useful to measure:
- Engagement rate
- Follower growth rate
- Post reach
- Site traffic from social media
4. Return on investment
A big issue for marketing agencies is proving their worth to their client, so measuring how much profit is generated from a campaign compared to how much was spent will be of particular importance to measure. If you can prove that you are generating profits for your client then they are much more likely to continue working with you.
Related reading: KPIs that marketing agencies should track

KPIs in Finance
The goal of most financial KPIs is to measure how well the company is performing in terms of revenue and profits. It makes sense to measure KPIs that provide a clear indication and overview of the financial situation of the company. These can include:
- Operating cash flow
This is a measure of how much cash a company has as a direct result of its normal operations and reflects the company’s ability to pay for short-term, regular expenses. Without a positive operating cash flow, a business is unlikely to remain solvent in the long run. - Gross profit margin
This measures the percentage of revenue left after deducting the cost of goods sold. In other words, the measure of overall profitability for a specific product or service, without accounting for overheads. - Net profit margin
This measures the percentage of revenue and other income after deducting all costs for the business, including goods sold, operating costs, interest and taxes. Net profit margin is a measure of profitability for the business in general, taking everything into account. - Quick ratio
This is a liquidity ratio that measures the assets that can be converted into cash quickly, and can come in the form of short-term investments, marketable securities, cash equivalents or current accounts receivable. This value does not include inventory as it is not likely that you will be able to quickly convert your inventory into cash.
KPIs in Sales
Sales teams are probably the most data reliant teams within a business and are often under a lot of pressure to grow revenue, beat the competition, and increase customer lifetime value, so it’s clear they need to monitor a lot of data. Here are a few KPIs to get you started:
- Sales growth
If your business isn’t growing then something is wrong. Sales growth is essential to achieve overall business success. Tracking sales growth will show how much your revenue changes over a period of time and will give actionable insights you can use in sales processes, strategies and financial forecasting. - Sales targets
It goes without saying that sales targets are essential for sales teams. Targets can be based on the number of units sold, contacts gained, demos booked etc. It gives team members a goal to work towards and is much more motivating having a specific figure to aim for rather than working towards nothing. It also highlights the stronger members of the team and allows you to provide guidance and further training to the weaker team members to help improve performance. - Opportunities
This refers to the number of qualified prospects that have a high chance of becoming actual customers. Measuring this allows the sales team to determine which opportunities are the most likely to convert into sales and worth pursuing further. You can also use this figure to monitor the number of opportunities each sales rep is creating. - Lead conversion rate
Having a high number of leads is pointless if none of them converts into actual customers. Measuring this will allow you to assess the effectiveness of pitches and adjust the process to target more qualified leads. This figure is usually a combination of input from both the sales and marketing team and involves effective lead nurturing strategies in order for the prospect to move from a lead into a customer. - Sales to date
Looking at this figure gives a good indication of historical trends by comparing one period to another, usually per week, month, quarter or year. You can use the data to measure what sales tactics are working well, how new products are selling and whether seasonality has any impact on sales. It will also allow you to plan for any traditionally busy or quiet periods based on the previous periods' figures.
Related reading: 12 KPIs to include in your sales analytics dashboard
KPIs in C-suite
A dashboard can provide CEOs and other c-suite executives with a comprehensive and real-time view of how their business is doing, rather than having to rely on manual reports or pulling data from various systems. Most c-suite execs will track KPIs from across the business such as customer success, marketing, sales, and finance. Here are a few examples:
- Return on equity (ROE)
CEOs are responsible not just for running the business, but keeping shareholders happy. ROE measures the profitability of the company compared to the equity of stakeholders. It is measured by dividing net income by the average shareholder's equity. Anything above 10% is considered an average rate of return and means that your shareholders should be relatively happy. - EBITDA
EBITDA stands for Earnings Before Interest, Taxes, Depreciation, & Amortization. It measures a company's financial performance and is often used as a proxy for its operating cash flow. In simple terms, EBITDA is a measure of a company's profitability that is calculated by taking its revenue and subtracting all of its expenses, except for interest, taxes, depreciation, and amortization. These items are excluded because they are not considered to be part of a company's core operating activities, and can vary greatly from one company to another.
C-suite executives like EBITDA because it provides a quick and easy way to measure a company's profitability and operating performance, without being affected by factors such as interest expenses, taxes, and accounting choices. - Net promoter score
Customer KPIs are very important for CEOs to track and Net Promoter Score (NPS) provides plenty of insight. NPS is a customer loyalty metric that measures the willingness of customers to recommend a company's products or services to others. The score is calculated by asking customers to rate their likelihood of recommending your business on a scale of 0 to 10. Respondents with a score of 9 or 10 are considered "Promoters," those with a score of 7 or 8 are "Passives," and those with a score of 0 to 6 are considered "Detractors." The NPS is calculated by subtracting the percentage of Detractors from the percentage of Promoters. The score can range from -100 to 100, with higher scores indicating more positive sentiment.
NPS is a way of measuring the customer loyalty, which can be helpful in predicting business growth, an important performance measure for any senior management team. - High performer turnover rate
C-suite also need to be aware of how their employees are doing. A useful KPI for this is measuring your high performer turnover rate. It refers to the rate at which an organisation's top-performing employees leave the company. These are typically employees who have consistently met or exceeded performance expectations and are considered valuable assets to the organisation. High performer turnover can be a significant problem for businesses, as losing top performers can result in a loss of productivity, expertise, and can negatively impact overall organisational performance. It can also be an indicator of everything from poor company culture to line management performance.
KPIs in Ecommerce
Making informed, strategic decisions is super important in e-commerce. In order to do that, you need to have an in-depth understanding of your business, and KPIs are a great tool for doing that. So what ones should you track? There are an infinite number of possibilities, so it's best to start simple, for example:
- Site traffic
This is of particular importance to an e-commerce business as they rely solely on online transactions. Looking at where the traffic is coming from is helpful to determine what campaigns are working well and what aren’t. You can also follow the online journey of visitors and detect where they leave the website and make any adjustments to those web pages. - Conversion rate
The hard work isn’t over once you get visitors to your website. You need them to take an action, whether it’s signing up to your newsletter, submitting an enquiry form or better yet - making a purchase. The higher the conversion rate, the higher quality of leads you are attracting. - Shopping cart abandonment rate
Shopping cart abandonment is when a website visitor adds items to their shopping cart, begins the check-out process and leaves without actually making a purchase. This is one of the biggest contributors to lost sales in the e-commerce industry. If you notice a lot of customers get to the check-out and then leave without completing their purchase, you need to take a deeper look at your prices, the checkout process, delivery costs and timeframes etc. - Average order value
Obviously the higher the average order value, the better. Average order value is a good metric to measure as it will highlight any customer purchasing patterns and help to understand customer behaviour. If you see this value increasing, it either means customers are buying more expensive items or are adding more items to their shopping carts.
Related reading: How to Build the Perfect Shopping Cart Abandonment Campaign
KPIs in SaaS
SaaS companies rely heavily on monthly subscriptions and repeat purchases. The growth and profitability of most companies, particularly SaaS companies, are highly dependent on data-driven decisions. Some popular KPIs include:
- Customer churn
Customer churn is the number of customers who cancel their subscription with you after a given period of time. An important KPI for most businesses, but more so for SaaS as they rely heavily on monthly subscriptions and retaining their existing customers. - Revenue churn
With customer churn comes revenue churn, which is the amount of revenue lost in a specific period. Some customers will generate more monthly revenue than others due to different pricing options or subscription types, so it’s important to monitor this to highlight where exactly the revenue is being lost. Is it from one big client who spends a lot with your company, or is it lots of smaller clients who spend less? - Monthly recurring revenue (MRR)
MRR measures the total amount your customers have spent on the product or service each month. It is a useful metric for predicting the future of the business and will help in decision making for financial planning and forecasting. - Net promoter score
This is a qualitative and quantitative way to directly measure how much value your customers place on your product and how satisfied or unsatisfied they are and allows you to make adjustments where necessary. You can speak to customers who have given a low score to learn more and how to go about fixing the issue to avoid future customers having the same issues.
Related reading: 7 KPIs your SaaS company should be tracking
KPIs in HR
Human resources KPIs analyse how efficient an HR team is in achieving the overall HR strategy and how it’s contributing to the rest of the organisation. Establishing HR KPIs is essential to achieving the best return from a company’s human capital. Using HR management software, it is possible to automate this process and avoid the costs that come with manual processes. Establishing HR KPIs is essential to achieving the best return from a company’s human capital.
- Absence rate
You should expect your staff to be off for sickness or other reasons throughout the year, but if it becomes too often and for too long then the problem needs to be addressed. It may highlight that an employee may be experiencing issues outside of work that your HR department may need to be aware of, or that the employee is demotivated or unengaged in work. - Net promoter score
This measures how employees feel about their workplace and how satisfied they are. Monitoring this is helpful as it gives you the opportunity to find out why employees feel the way they do and make changes to improve, which will help to increase staff retention, lowering hiring costs in the long run. - Staff turnover rate
Turnover rate is a measurement of how many employees have left a company within a certain time frame. It costs time and money to hire new employees, so naturally the lower the turnover rate, the better. If turnover is high, HR managers can take steps to lower turnover such as boosting employee morale, changing the company culture or reviewing salaries and perks. - Time to hire
This refers to the time it takes from a candidate submitting their application for a job to a candidate accepting the offer. Measuring this highlights how effective the recruitment process is and if there are any main roadblocks that slow down the process. Looking at this value can help in the hiring process. For example, if you know how long it takes on average to replace a member of the sales team, you can start your hiring process earlier to allow for the time it takes to replace.
Even with the best intentions, you can build and track your KPIs and not see the results you’re looking for. That doesn’t necessarily mean you’re not performing well, the problem could be the KPIs themselves. Here are some of the most common mistakes we’ve seen and how you can avoid them.
Measuring too much
Just because you can measure something doesn’t mean you should. We’ve gone through how to choose your KPIs for a reason, it’s important to only track targets that are relevant to you, your team, and your business. Otherwise, you risk having too much information, which is overwhelming and negates one of the main reasons for tracking KPIs to begin with - simplicity.
Just because you can measure something doesn’t mean you should. We’ve gone through how to choose your KPIs for a reason, it’s important to only track targets that are relevant to you, your team, and your business. Otherwise, you risk having too much information, which is overwhelming and negates one of the main reasons for tracking KPIs to begin with - simplicity.
Not measuring results
We’ve said before, KPIs should measure the performance of an action, not the action itself. When you track the action, like making a certain number of sales calls per day, there is no discernable way to determine performance. Yes, a salesperson may have only made 3 of 10 calls that day, but if every one of those three calls results in a sale, have they really underperformed?
Relying on industry benchmarks
Benchmarking can be a useful exercise, but when it comes to KPIs, industry benchmarks mean very little. Businesses who make the mistake of using industry benchmarks to set their own targets are setting themselves up for failure because they’re not taking their own unique circumstances into account. Industry benchmarks are an average, so they take into account the highest and lowest performing businesses. They can also be far too generalised to be of much use. A SaaS company offering a free app will have very different goals than a premium online events platform, for example. And yet, many industry reports would put them in the same category.

Not reviewing your KPIs regularly
Another very common mistake is not regularly reviewing your KPIs. As our businesses grow and evolve, so too should the targets and KPIs we are tracking. What good is knowing the trial to customer conversion rate if you’ve stopped running trials? Ensuring any and all KPIs you do track are current will ensure you’re working with the most relevant information, allowing you to make decisions that will help you succeed.
Not acting on KPI results
KPIs should always be a driver for change. Tracking KPIs without following up with a plan of action is useless. The businesses who fail to reach their KPIs, or fail to grow as a result of comprehensive KPI reporting, usually do so because they think the KPIs themselves are the end goal.
Not using the right tools
Excel and Google sheets are great tools, but they are also very time-consuming. Unless you’re an expert, they can be very manual. If you’re tracking KPIs in a largely manual way, you aren’t really saving yourself that much time. Budget can be a sensitive subject, but a lot of businesses will make do with subpar tools to save money, without accounting for the time they are wasting with manual tools.

Read more about common KPI mistakes here.
As we’ve seen, there are a lot of elements to consider when you’re putting together your KPI strategy. The most important is that KPIs should be tools to help you, not hinder you. If you feel overwhelmed or like your KPI strategy isn’t working for you, don’t be afraid to review and revise. Nothing is permanent. Like a lot of things with business, it will take some trial and error. All you can do is make sure you have the willingness to take action and the right tools at your disposal.


Ashleigh McCabe
Content Marketing Specialist
.jpg?width=2448&height=2448&name=CYMERA_20210218_133809%20(1).jpg)
Melissa Hugel
Content Marketing Manager

Jonny Robinson
Graphic Designer

What is a Key Performance Indicator (KPI)?

Marketing Dashboard Examples: 7 Templates You Can Copy
